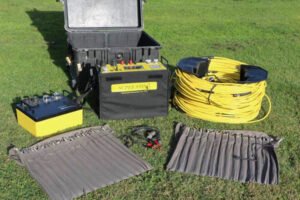
Resistivity Scans
PLEASE NOTE- John Larsen has given us exclusive permission to use his information. It cannot be copied or used in any manner without his permission. His website is arksubsurface.nz .
2014 Resistivity Scanning
This chapter will go into a great deal of detail because this information is so important. It revealed spectacular information about what lies beneath the surface of Noah's Ark and it is important for you to understand it, not just take our word for it. Part 2 will give even more information on the actual results what were obtained and they are stunning!
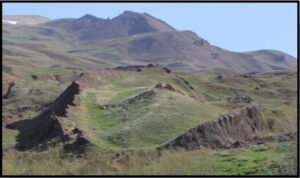
In 2014, John Larsen of New Zealand obtained a permit to do resistivity scanning on Noah's Ark.
The Man who did the Scans- John Larsen
Doing resistivity scanning over such a large area required an operator who understood many different scientific fields. John received his Bachelor of Science degree in physical geography, which is the study of how landforms develop, water erosion, glaciology, climatology, sedimentation etc. The first 2 years of that degree he spent studying Geology, including paleontology (fossils), crystal structure, plate tectonics etc. He then did a further 2 years towards an engineering degree, which included a heavy load of mathematics.
Living in New Zealand, he was very interested in Ron's work at Noah's Ark and began looking at what other types of equipment were available that could penetrate deeper than radar for the Ark site. Right when he began researching equipment, the latest type of resistivity equipment had just been released that very same week. Being very expensive equipment, John, without hesitation, sold his house, bought the equipment and travelled to the United States to do the training course for it at Advanced Geosciences in Austin Texas.

What is Electrical Resistivity Scanning?
The results you will see here are so astounding, it is important that you understand how resistivity scanning works.
Description:
Electrical resistivity scanning is a geophysical technique used to explore what lies beneath the surface of the ground without digging. It measures how strongly the earth resists the flow of electricity, which varies depending on the materials underground—such as rock, soil, water, voids, or buried objects like metal or stone structures.
How It Works:
-
Electrodes are placed in the ground – A series of metal stakes (called electrodes) are inserted into the ground in a straight line or grid. These electrodes are connected by wires to a resistivity meter.
-
Electrical current is sent into the ground – The device sends a small, controlled electric current through two of the electrodes. The current travels through the earth, and its behavior changes depending on the underground materials.
-
Voltage is measured – The system then measures the resulting voltage difference between two other electrodes. Using this data, the device calculates the resistivity of the ground at different depths.
-
Data is collected from many points – By moving the electrodes or using many at once, the device gathers resistivity readings from a wide area and at various depths.
-
Computer software creates an image – These readings are fed into software that creates a 2D or 3D model (often a cross-section) showing areas of high and low resistivity. Different colors or shading indicate different underground features, such as moist soil, dry rock, water-filled cavities, or buried walls.
What It Detects:
-
Underground voids or tunnels
-
Water tables or water-saturated zones
-
Different layers of rock or soil
-
Archaeological features (walls, foundations, tombs)
-
Buried utilities or metal objects (though metal-detecting is more precise for this)
Why It’s Useful:
Electrical resistivity scanning is non-invasive and ideal for archaeological surveys, environmental studies, groundwater research, and engineering projects. It helps researchers “see” underground without disturbing the site, making it especially valuable in sensitive areas.
Turkish Government Issued John Larsen a Permit
In September 2014, the Turkish government granted a permit to John to allow the remains of this buried object to be scanned using the latest deep penetration resistivity ground imaging technique.
The equipment used was the Advanced Geosciences Supersting R1, with 56 electrodes and the ability to run a single scan 165 metres in length.
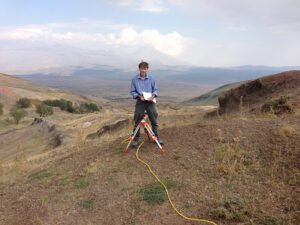
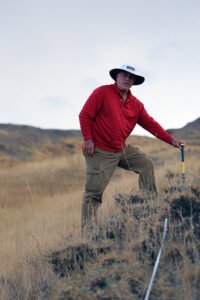
After receiving permission from the Turkish Government, John Larsen with the help of Randall Lee began the first of a series of thirteen individual scans.
The 2014 Resistivity Scanning on Noah's Ark Begins
It was late summer in Eastern Turkey, and although the ground was dry after the hot summer months, frequent thunderstorms were keeping the top layer of soil moist. This provided especially good conditions for resistivity scanning as the damp soil helped to make a good connection for the electrodes without being over saturated.
John and my present husband, Randall Lee, performed the scans under less than ideal conditions. It was imperative that John have accurate GPS readings on all the electrodes in order for them to work properly when all the data was combined into 3d models. One day, they discovered all their GPS stakes were removed by locals. All but one, that is! And that one stake allowed John to continue the work by reestablishing all the other stakes. That was truly a miracle!
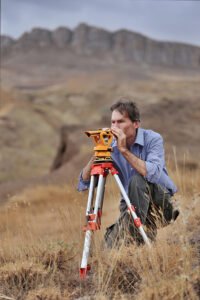
The position and elevation of each of the electrodes was measured, as well as the three dimensional profile of the ground immediately surrounding the site. From this information, the three dimensional topography of the ground surface was able to be mapped and included with the resistivity data during the analysis.
Death Threats
Then came the call to John and Randall's driver one day, threatening their lives if they continued the work. But they had come so far, that nothing was going to interfere with the scans. Both men had no intention of quitting. We know who instigated the attempts to stop the work but John and Randall just kept on working.
The Grid Pattern of the Scans
Ten parallel, separate, longitudinal scans of the ship were taken, where each individual scan covered the entire length of the ship in one piece, with the electrodes of each scan being spaced three meters apart.
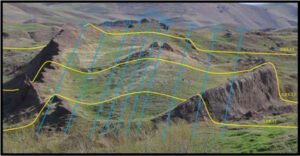
This was then followed by three cross section scans where the electrode spacing was reduced to two meters. More lateral scans were planned but were not able to be done due to weather complications and interference by locals.

The First 2D Scan Results
While in Turkey, John could only produce 2 dimensional images. And we were hoping that one day while we were there, we would get to see at least something. Then the day came when the weather was bad and John spent the day in his room. Later that afternoon, he summoned us to the dining room upstairs. There he revealed the first images and they were breathtaking!
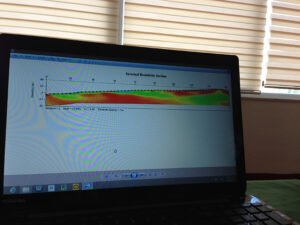
It revealed that the ship was indeed streamlined, like a modern ship! We were excited to say the least. It also showed the missing part of the hull that Ron had also found with his equipment! (The red shows the missing part of the hull.)
And besides the streamlined shape of the ship and the missing portion of the hull, the other exciting revelation was the the ark was NOT completed collapsed and pancaked down! It extended approximately 40 plus feet into the earth! This was something Ron couldn't determine with the limitations of his early sub-surface interface radar scanning. While he could focus to different depths, he could not determine the actual depth- only that it was lower than the previous scan.
The 3D Software was Limiting at First
The scans were finished, the data was painstakingly collected and we all headed home. John then processed the data as a three dimensional file which took him a couple of years to complete.
In 2016, the first views were completed. At this time the processing software had the limitation of only being able to combine multiple straight line scans, which were all parallel to each other to form a 3d data set. This meant that the data from the three cross section scans could not be included with the longitudinal scans, which limited the area of the Ark, which could be viewed.
The 3D Software is UpGraded
The capability of the processing software was expanded when the next upgrade of the program was released. The new program now had the ability to process multiple lines of resistivity data from scans orientated in different directions. With the data from the cross section scans now included, the entire area of the ship could be processed in one piece.
John also had the ability to filter out materials of differing densities which allowed him to isolate features and view them in depth.
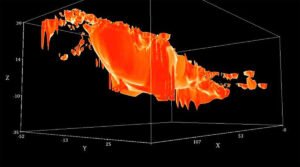
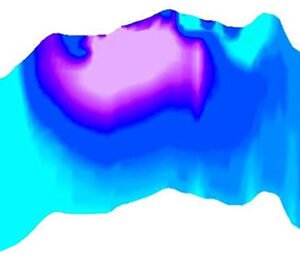
Viewing the side of the ship, from its port (left) side, the below image shows the total length of the hull from an angle. The outline of the entire shape of the hull, which lies buried beneath the ground, can be seen.
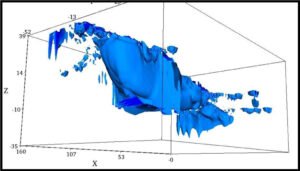
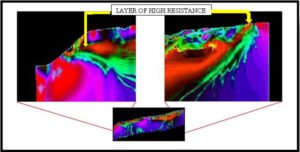
1st- Determining the Extent of the Limestone Outcrop Which Impales the Ship
John's first consideration was to locate and determine the extent of the rock outcrop which has impaled the right side of the ship and visually appears to penetrate through to its center.
The boundaries between the rock and the material around it are clearly distinguished and both of these substances, which can be identified at the surface, can be traced on the resistivity images beneath the ground and down through the structure of the ship.
These two substances (the rock, and the hull shape) have slightly different resistances which cannot be explained by any variations in moisture throughout the structure. This implies that the material making up the outline of the hull of this vessel is not the same as the rock but instead is a totally different substance.
The rock outcrop itself penetrates to within eight meters of the centerline of the vessel on the right side of the ship. A top section of this rock has fallen over onto the top surface of the ship, making it appear that the total rock mass cuts into the ship further than it actually does. However the cross section images of the hull at this point show that the main mass of the rock does not reach to the middle of the hull.
The purple area in the center of the below image shows the extent of the rock outcropping and accounts for the major damage it did to the ark. It is actually much larger than we realized. But it doesn't extend into the ship as much as we thought.
The outline of the hull does not appear to wrap around the rock outcrop, but is abruptly cut where the rock intersects with the hull shape. This is consistent with the damage which would be expected to take place if a timber hulled vessel struck a rock and became impaled upon it.
The packing together of the resistivity contour lines at the boundary between the ship and the surrounding material indicates that a sudden change in material properties takes place at this boundary.
The Hull
The scans also show that the hull shape is not a solid single block of material. Instead, the material forming the hull is a shell of material with both an external and an internal surface to the hull shape. This shell of material encompasses a regular internal structure as would be expected to be seen in a ship. You will be able to see this in part 2.
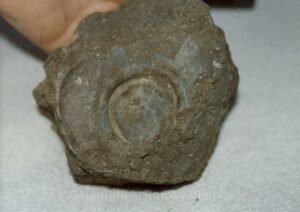
The resistivity values of the material forming the hull profile are also the same above the ground as they are beneath. This indicates that the same material makes up the entire hull shape and that this material is relatively impermeable to water and is a hard substance which has retained its shape. Ron believed the entire ship had undergone the petrification or mineral replacement process.
The Decks
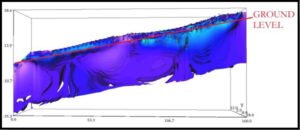
The ship is severely damaged, as should be expected. The resistivity images, show that within the hull shape there are three distinct flat surfaces of material which exist and extend across the width of the inside of the hull shape.
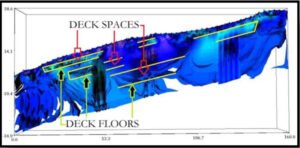
The uppermost surface is seen as a layer of material with a thickness of approximately 3.2 meters which equals 6 cubits in the ancient measurement system. The middle layer measures 4.7 meters in thickness, whilst the third and lowest flat surface can be seen positioned at the bottom of the inside surface of the hull shape.
The material which forms these layers also has the same resistivity value as the material which forms the hull shape, indicating that they are probably both composed of the same material.
Each of these three surfaces are parallel to each other. They are also orientated in straight lines and aligned with the same angle (approx. 12 degrees), which the hull shape now rests on.
The material occupying the space between each of these decks displays a different resistivity. Also the change in resistivity between the infilling material and the material of the deck is abrupt and can be seen by the tightly packed contour lines which follow the boundaries between each of the deck layers and the infilling material which are seen in the resistivity images.
When the resistivity image of the boat is viewed in three dimensions, the floors of the three flat deck layers can be seen to cover the full width of the ship and do not extend beyond of the edge of the hull outline.
No similar flat planar layers of material have been found outside of the boat shape even although the three cross sectional scans covered an area projecting 116 meters in width and included the ground on each side of the vessel. These flat deck layers are unique and are only found within this vessel.
None of the three layers can be seen to penetrate through the outer shell material of the hull shape which encapsulates all three of these deck layers.
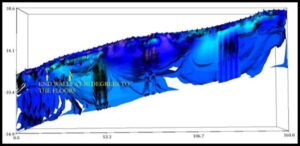
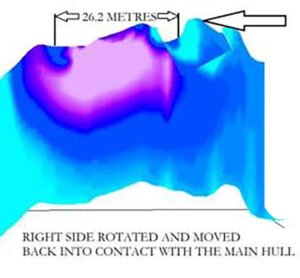
Damage to the Side of the Ship
The damage caused to the right side of the ship by its impact with the rock outcrop, has distorted the right side and caused the hull to bulge outwards as it is seen today. This makes the present shape of this ship appear to be wider than it really is.
The subsurface resistivity images of this area show that the top part of the hull on the right side has broken away and separated from the main section of the ship and also tipped outwards as if it were sliced.
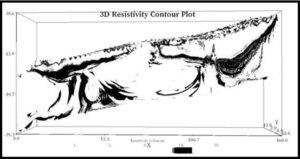
The below image shows a cross sectional image across the widest part of the hull shape. The intact section of the hull, which includes the left side and the center of the vessel, can be seen here to be considerably more resistive (dark blue) than the separated section of the right side (light blue). This would be expected because in a timber ship, the amount of damage which the right side has sustained would almost certainly have cracked the hull's structure in that area making it more permeable to water and increasing its conductivity.
In the second image below, the right side of the hull shape is shown repositioned and moved back into its original place where it again joins onto the main hull section and is symmetrical to the left side.

Welcome to the Ron Wyatt Archives. I'm Mary Nell (Ron's wife) and this site will attempt to fully document Ron Wyatt's work and discoveries. This website will be an ongoing project to document his work on all his various discoveries. Please check back often as new things will be added constantly.
| READ MORE |